Stock Market Correction Tends to Happen When the Market Gets Apathetic
Somebody wake me up from my slumber. U.S. stock trading has been decidedly lackluster in August, at least from a volume perspective. Historically, extremely low volume combined with low volatility has been a recipe for a coming stock market correction. With a witch’s brew of negative catalysts on the horizon, all it needs is a trigger.
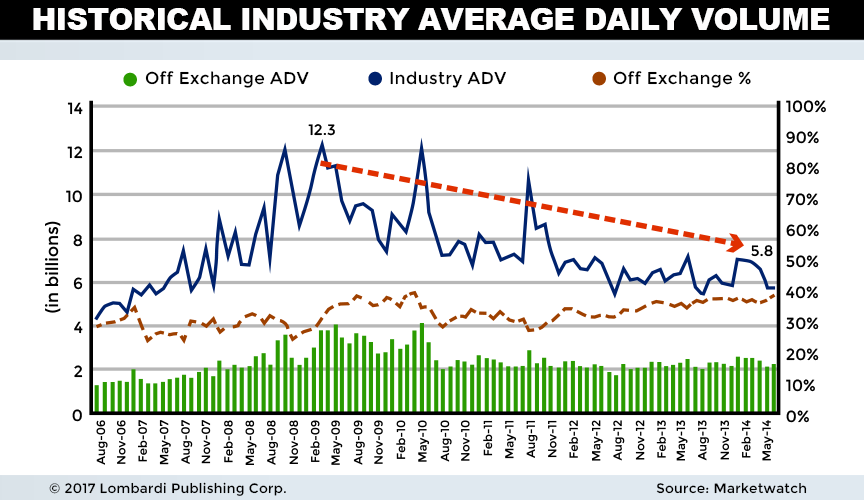
The declining volume phenomenon has actually been taking place since the time of the U.S. Housing Bubble. Average daily volume (ADV) peaked during the crisis at 12.3 billion shares on the Dow Jones Industrial Average (DJIA). By May 2014, that number dwindled to around 5.8 billion shares traded.
Advertisement

Also Read: Stock Market Crash 2017? This Could Trigger a Stock Market Collapse
Fast forward to 2017, nothing’s really changed. The ADV for August 2017 so far is 5.98 billion shares, and for the year, it’s 6.54 billion shares. It’s noteworthy that there has not been much volume growth following a rally that has been historic in nature. (Source: “U.S. stocks trade at lightest volume of year on Wednesday,” MarketWatch, August 23, 2017.)
The trend continues towards apathy. Shares on August 23, 2017 traded at their lowest levels of the year. Stock volume analysis shows that only 1.6 billion shares traded hands that day, according to Dow Jones data. NASDAQ volume wasn’t much better. Just 1.51 billion shares traded; the second-slowest clip in 2017. It seems like a whole bunch of people are sitting on their hands.
That’s generally a problem for a market trying to sustain momentum on the upside. Although I’ve documented how the slow-motion melt-up has been fueled by a lack of selling volume, at some point, the bulls will need a market driver. Whether that comes from robust Trumpian tax cuts, or perhaps the trillions of dollars of offshore earnings repatriation, is unknown. But low-volume melt-up dynamics are likely coming to an end.
U.S. Stocks Trade at Lightest Volume of the Year
As I’ve noted, the DJIA traded at its lowest volume in 2017. The S&P 500 and NASDAQ weren’t far behind. Much of this is attributable to the “summer doldrums” and the Fed policy meeting in Jackson Hole, Wyoming. The market simply has no impetus to make a major move.
This lack of stock-trading activity doesn’t necessarily mean much in isolation. But if DJIA volume starts soaring in the early fall, watch out. Anything above 1.5-times ADV (around 10 billion shares) could signal that the bear is awaking, especially in conjunction with rising volatility. The recipe is quite simple: high volume + high volatility = a stock market crash 2017 is imminent or occurring.
For market bulls, no news is good news. You’ll want a sleepy fall session. If we don’t get that, watch out. The September legislative session in Congress, which includes debt ceiling negotiations, will set the tone for the rest of 2017.